Trailer/Body Builders' Aftermarket Parts & Accessories survey
While trailer and Class 8 truck sales have experienced a slowdown in 2016, industry parts departments appear to be booming, according to the results of a Trailer/Body Builders survey.
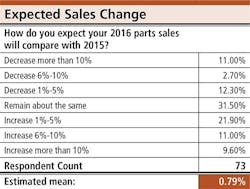
The 73 respondents—trailer dealers, repair shops, truck equipment distributors, and parts specialists—are bullish about this year, with 74% saying they are expecting their parts sales to either remain about the same or increase when compared to 2015. That breaks down like this: 31.5% expect sales to remain about the same; 21.9% expect them to increase 1%-5%; 11% expect them to increase 6%-10%; and 9.6% expect them to increase more than 10%.
On the down side, 11% say they expect parts sales to decrease more than 10%, 2.7% expect a decrease of 6%-10%, and 12.3% expect a decrease of 1-5%.
Our last parts survey came in 2010, a few years after the commercial truck body and trailer business was hit hard by The Great Recession. At that time, industry parts departments were far more consistent than other areas. Of 245 completed surveys, truck equipment distributors, trailer dealers, parts specialists, repair shops, and truck dealers all reported that parts sales in 2010 would be within 2% of 2009 sales—either positively or negatively. The one exception involved truck dealers, who reported parts were selling at a pace that would fall 11% short of 2009 sales.
Our 2016 survey did not categorize the results by type, other than to identify the percentage of respondents in each one: trailer dealer, 31.5%; repair shop, 27.4%; truck equipment distributor, 16.4%; parts specialist, 13.7%; and other, 11%. (Others listed: aluminum distributor, body shop, parts distribution, trailer manufacturer, transportation, truck sales, and truck upfitter/repair shop/ manufacturer. One respondent said all four categories apply to its company.)
Wisconsin led all states in terms of where the company is located (12.3%), followed by Texas (11%), Massachusetts (8.2%), Missouri, Ohio, and Tennessee (5.5%), Illinois, Michigan, and Washington (4.1%), Arizona, Florida, Louisiana, New York, Oklahoma, and Pennsylvania (2.7%), and Alabama, California, Colorado, Georgia, Hawaii, Kentucky, Minnesota, Nebraska, New Jersey, Oregon, Rhode Island, Virginia, and West Virginia (1.4%), along with the Canadian provinces of Alberta, Manitoba, Ontario, and Quebec (1.4%).
Parts sales volume
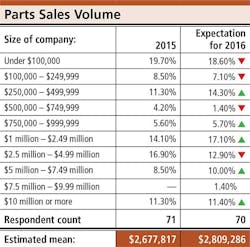
The biggest increase in parts sales volume in 2016 (3%) is expected in two different categories: $250,000–$499,999 (14.3%, from 11.3%) and $1 million–$2.49 million (17.1%, from 14.1%).
The biggest decrease in 2016 (4%) is expected in the $2.5 million–$4.99 million category, with 16.9% of companies, compared to 12.9%.
The mean sales volume for the respondents is a 4.9% increase, from $2,677,817 to $2,809,286.
Total parts sales volume in 2015: under $100,000, 19.7%; $100,000–$249,999, 8.5%; $250,000–$499,999, 11.3%; $500,000–$749,999, 4.2%; $750,000–$999,999, 5.6%; $1 million–$2.49 million, 14.1%; $2.5 million–$4.99 million, 16.9%; $5 million–$7.49 million, 8.5%; $7.5 million–$9.99 million, 0%; $10 million or more, 11.3%.
Total expected parts sales volume in 2016: under $100,000, 18.6%; $100,000–$249,999, 7.1%; $250,000–$499,999, 14.3%; $500,000–$749,999, 1.4%; $750,000–$999,999, 5.7%; $1 million–$2.49 million, 17.1%; $2.5 million–$4.99 million, 12.9%; $5 million–$7.49 million, 10%; $7.5 million–$9.99 million, 1.4%; $10 million or more, 11.4%.
Average gross margin
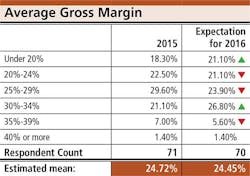
The biggest increase in average gross margin in 2016 (5.7%) is expected in the 30-34% category: 26.8%, from 21.1%.
The biggest decrease in 2016 (5.7%) is expected in the 25-29% category, 23.9%, compared to 29.6%.
The mean gross margin for the respondents is a .27% decrease, from 24.72% to 24.45%.
Average gross margins for 2015: under 20%, 18.3%; 20-24%, 22.5%; 25-29%, 29.6%; 30-34%, 21.1%; 35-39%, 7%; and 40% or more, 1.4%.
Average gross margins for 2016: under 20%, 21.1%; 20-24%, 21.1%; 25-29%, 23.9%; 30-34%, 26.8%; 35-39%, 5.6%; and 40% or more, 1.4%.
Average parts inventory
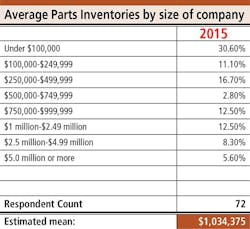
The biggest increase in average parts inventory 2016 (7.3%) is expected in the $500,000–$749,999 category (10.1%, from 2.8%).
The biggest decrease in 2016 (3.1%) is expected in the under–$100,000 category (27.5%, from 30.6%).
The mean average parts inventory went up 5.7%, from $1,034,375 to $1,093,478.
Average parts inventories in 2015: under $100,000, 30.6%; $100,000–$249,999, 11.1%; $250,000–$499,999, 16.7%; $500,000–$749,999, 2.8%; $750,000–$999,999, 12.5%;
$1 million–$2.49 million, 12.5%; $2.5 million–$4.99 million, 8.3%; $5 million or more, 5.6%.
Average parts inventories in 2016: under $100,000, 27.5%; $100,000–$249,999, 11.6%; $250,000–$499,999, 14.5%; $500,000–$749,999, 10.1%; $750,000–$999,999, 10.1%; $1 million–$2.49 million, 10.1%; $2.5 million–$4.99 million, 10.1%; $5 million or more, 5.8%.
Inventory turn
It is expected to remain exactly the same in 2016: 3.7.
Personnel
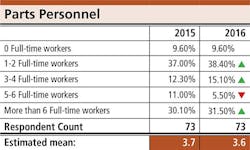
Respondents are slightly reducing the number of people who work full-time in their parts departments, with the mean dropping from 3.7 to 3.61.
The biggest drop came for those who had five or six in their parts department in 2015. That number fell 5.5%, from 11% to 5.5%.
The biggest increase came for those who had three or four: 2.8%, from 12.3% to 15.1%.
The breakdown for 2015: zero full-time workers, 9.6%; one to two, 37%; three to four, 12.3%; five to six, 11%; and more than six, 30.1%.
The breakdown for 2016: zero full-time workers, 9.6%; one to two, 38.4%; three to four, 15.2%; five to six, 5.5%; and more than six, 31.5%.
In the 2010 survey, the average industry parts department had 3.09 employees.
Parts sales per employee
Respondents expect parts sales per employee to go up 4.1% in 2016: $586,966, compared to $563,528 in 2015.
If that happens, it would represent a 28.2% increase over the average parts sales per employee in the 2010 survey: $421,015.
Parts manager salaries
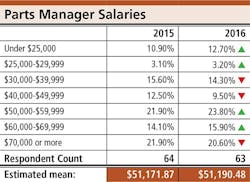
Compensation is expected to go up only marginally in 2016, with 64 respondents giving figures that produce a mean of $51,190.48—up .04% over 2015’s $51.171.87.
The biggest increase in parts managers’ salaries is expected in the $50,000–59,999 category: 1.9%, from 21.9% to 23.8%.
The biggest decrease is expected in the $40,000–$49,999 category: 3%, from 12.5% to 9.5%.
The breakdown for 2015: under $25,000, 10.9%; $25,000–29,999, 3.1%; $30,000–39,999, 15.6%; $40,000–49,999, 12.5%; $50,000–59,999, 21.9%; $60,000–69,999, 14.1%; $70,000 or more, 21.9%.
The breakdown for 2016: under $25,000, 12.7%;
$25,000–29,999, 3.2%; $30,000–39,999, 14.3%; $40,000–49,999, 9.5%; $50,000–59,999, 23.8%; $60,000–69,999, 15.9%; $70,000 or more, 20.6%.
In the 2010 survey, the average industry parts manager’s salary was $42,680.
Inside sales personnel salaries
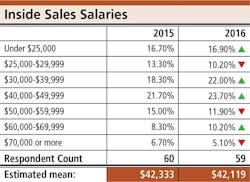
Compensation is expected to go down marginally in 2016, with 60 respondents giving figures that produce a mean of $42,118.64—down .5% over 2015’s $42,333.33.
The biggest increase in inside sales personnel’s salaries is expected in the $30,000–$39,999 category: 3.7%, from 18.3% to 22%.
The biggest decrease is expected in the $25,000–$29,999 category: 3.1%, from 13.3% to 10.2%.
The breakdown for 2015: under $25,000, 16.7%; $25,000–$29,999, 13.3%; $30,000–$39,999, 18.3%; $40,000–$49,999, 21.7%; $50,000–$59,999, 15%; $60,000–$69,999, 8.3%; $70,000 or more, 6.7%.
The breakdown for 2016: under $25,000, 16.9%; $25,000–$29,999, 10.2%; $30,000–$39,999, 22%; $40,000–$49,999, 23.7%; $50,000–$59,999, 11.9%; $60,000–$69,999, 10.2%; $70,000 or more, 5.1%.
Outside sales personnel salaries
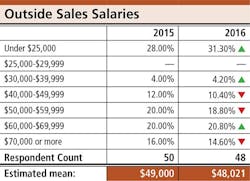
Compensation is expected to go down marginally in 2016, with 48 respondents giving figures that produce a mean of $48,020.83—down 1.9% over 2015’s $49,000.
The biggest increase in inside sales personnel’s salaries is expected in the under–$25,000 category: 3.3%, from 28% to 31.3%.
The biggest decrease is expected in the $40,000–$49,999 category: 1.6%, from 12% to 10.4%.
The breakdown for 2015: under $25,000, 28%; $25,000–$29,999, 0%; $30,000–$39,999, 4%; $40,000–$49,999, 12%; $50,000–$59,999, 20%; $60,000–$69,999, 20%; $70,000 or more, 16%.
The breakdown for 2016: under $25,000, 31.3%; $25,000–$29,999, 0%; $30,000–$39,999, 4.2%; $40,000–$49,999, 10.4%; $50,000–$59,999, 18.8%; $60,000–$69,999, 20.8%; $70,000 or more, 14.6%.
Top source for replacement components
Of the 70 companies who chose to identify the top source for replacement components, 41.4% said it’s an aftermarket buying group, followed by parts manufacturers (38.6%) and a parts program from the manufacturer that the company represents (20%).
That represents a significant shift since the 2010 survey, when parts manufacturers drew 48.4%, a parts program from the manufacturer that the company represents drew 42.2%, and an aftermarket buying group drew just 9.4%.
Top three best-selling product lines
Two products received six mentions among the 70 respondents: brakes and Meritor. Receiving five mentions were suspensions. Receiving four mentions were trailer parts. Receiving three mentions were Ancra, Automann, body parts, Hendrickson, lighting, and suspension parts. Receiving two mentions were brake parts, cargo control, Civacon, electrical, Haldex, landing gear, lights, NAPA, Stemco, Trucklite, and Western.
Best new product added in past three years
Of the 34 responses, there was a tie for best new product with two votes apiece: LED lighting and Automann USA.
The 30 other responses: Aero Conestoga, aerodynamic kits, air conditioning parts, air ride suspension components, bearings, BTI, composite parts, DEF, Donelson, DPF filters, Exaloy cargo control, golf cart tire/wheel assemblies, hydraulic jack repair, Kit Masters, liftgate parts, lighting, liquid anti-icing products, Morgan van body parts, Norstar truck bodies, pumps, Quick Draw tarp systems, side skirts, Sika, Silverback, skirts, tank parts, towing products, trailer floorings, trailer parts, and truck seats.
Biggest trend
We asked respondents to name the biggest trend affecting their parts department, and there was no single resounding answer.
Four respondents were concerned with price, whether it’s “competitive pricing from our suppliers” or “steep competition on pricing.”
Three others mentioned the economy, a downturn and “a flat business environment and the efforts required to maintain sales volume and increase margins.” Two others mentioned declining margins. One mentioned the Internet and another wrote, “We sell more online than in the past.”
Others:
• Aftermarket alternatives to OEM.
• All-makes outfitters. Auto parts stores stocking heavy parts.
• Crossing over into truck parts in lieu of trailer and truck equipment parts only.
• Ease of getting parts in overnight.
• Electronics.
• Fleet service.
• Getting parts locally.
• Higher costs.
• Hydraulic jack parts.
• Import parts.
• Inventory control.
• Keeping quality parts coming from the suppliers.
• Labor problems.
• Loss of customers to lease companies.
• New technology.
• Qualified help.
• Roll tarps and load ramps.
• Snow and ice solutions.
• The aging of our industry.
• Trucking industry slowdown and consolidation.
• We now work on trucks and have moved toward truck parts.
_______________________
How the survey was conducted
August 4, 2016, Penton Research—the research arm of Penton, parent company of Trailer/Body Builders—emailed invitations to participate in an online survey to all subscribers of Trailer/Body Builders that are distributors of truck trailers, truck bodies or truck equipment, factory-owned sales/service branch, or a repair shop for truck trailers or truck bodies. By August 26, Penton Research received 73 completed surveys.
To encourage prompt response and increase the response rate overall, the following marketing research techniques were used:
• A live link was included in the email invitation to route respondents directly to the online survey.
• Reminder emails were sent to non-respondents on August 10 and 18.
• The invitations and survey were branded with the property name and logo of Trailer/Body Builders in an effort to capitalize on subscriber brand affinity.
The methodology conforms to accepted marketing research methods, practices, and procedures.
About the Author
Rick Weber
Associate Editor
Rick Weber has been an associate editor for Trailer/Body Builders since February 2000. A national award-winning sportswriter, he covered the Miami Dolphins for the Fort Myers News-Press following service with publications in California and Australia. He is a graduate of Penn State University.

