Latest from Trailer Output
Latest from Trailer Output
ACT Research


Feb. 1, 2025
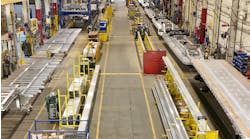
Extreme Trailers
Members Only Content
Feb. 22, 2024
547563038 | Adobe Stock

MOD Photography/BlueEdge

March 1, 2023

Image: Photo 17012935 Valentin M Armianu | Dreamstime.com

Jan. 14, 2023
ACT Research

Kevin Jones / TBB

This is part of the North American Trailer Output Report published each year in February. Use the links on the left to read the corresponding feature article or to access an archive of articles and tables from 1998 to the present.
2000 North American Truck Trailer Output |
|||
Rank and Company Name |
2000
|
1999
|
|
| 1 Wabash National Corporation | 66,283 | 69,772 | |
| 2 Great Dane Limited Partnership | 46,698 | 58,454 | |
| 3 Utility Trailer Manufacturing | 28,780 | 30,989 | |
| 4 Trailmobile Corporation (including Mond) | 28,089 | 31,329 | |
|
5 Stoughton Trailers 5,800 Chassis, 5,200 Containers |
15,050 | 14,673 | |
|
6 Strick Corporation 7,000 Chassis |
10,500 | 11,000 | |
| 7 Manac—Canam Manac Group | 8,052 | 8,200 | |
|
8 Hyundai Precision America 20,256 Chassis, 2,417 Containers |
6,261 | 5,716 | |
| 9 Fontaine Trailer Co (estimate) | 6,000 | 6,500 | |
|
10 HPA Monon Corp 7,387 Chassis |
5,726 | 8,386 | |
| 11 Dorsey Trailers (estimate) | 5,000 | 9,013 | |
| 12 Road Systems | 4,058 | 4,173 | |
| 13 Transcraft Corp | 4,005 | 5,128 | |
| 14 Wilson Trailer Co (estimate) | 4,000 | 4,000 | |
| 15 Lufkin Trailers | 3,779 | 5,632 | |
| 16 Trail King Industries (estimate) | 3,200 | 3,705 | |
| 17 Heil Trailer International (estimate) | 3,000 | 3,300 | |
| 18 Kentucky Manufacturing Co | 2,604 | 2,750 | |
| 19 East Manufacturing Co | 2,120 | 1,934 | |
| 20 Cottrell Inc | 2,000 | 1,200 | |
| 21 Timpte Inc | 1,680 | 1,650 | |
| 22 Polar Tank Trailer Inc | 1,600 | 1,850 | |
| 23 Ravens Inc | 1,483 | 1,875 | |
| 24 Benson International | 1,348 | 2,150 | |
| 25 MAC Trailer | 1,260 | 1,210 | |
| 26 Brenner Tank Inc | 1,200 | 1,420 | |
| 27 Pitts Trailer | 1,150 | 980 | |
| 28 Kalyn/Siebert | 930 | 1,178 | |
| 29 Beall Corp | 880 | 1,200 | |
| 30 Kidron Inc | 850 | 1,000 | |
| 31 Clement Industries | 763 | 1,197 | |
|
32 Armor Chassis LLC 3,400 Chassis |
200 | 300 | |
| Total | 268,549 | 301,864 | |