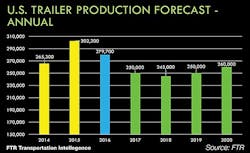
Don Ake, vice president of commercial vehicles at FTR, is forecasting United States trailer production of 279,700 for 2016, 250,000 for 2017, and 245,000 for 2018—with a caveat.
“We do not have a recession built into this forecast because if you build a recession into the forecast, you have to put a time on it,” Ake said in his Trailer Market Forecast. “If I can forecast the recession that well, then I’m going to go work somewhere else and makes tons of money. You can’t do that. You can’t put a recession in here. So you know that if a recession hits in 2018, we’re not going to be at 245,000. We’re going to be below 200,000.
There are some forecast risks, he said:
• If dry and refrigerated van build stays strong the entire year, add 12,000 trailers to the forecast.
• If housing recovers and infrastructure spending increases, raising demand for flatbeds and dumps, add 5000 trailers to the forecast. “It’s not likely at this point, but if the housing market would kick it in, you could get 5000 more trailers in this forecast.”
• If pent-up demand for vans slows down earlier than expected, subtract 12,000 trailers from the forecast.
• If the entire trailer market follows the truck market down, subtract 25,000 trailers from the forecast. “That does not look likely at this point, but no one expected the truck market to drop that fast either. So unfortunately, I guess we would have a warning if the trailer market started to show significant drop-offs, that’s where you would end up.”
Ake listed these overall economic forecasts: GDP, 1.8% in 2016, 2.1% in 2017; industrial production, 0% this year and 1.9% in 2017; Consumer Price Index, 1.2% this year, rising to 2.5% next year; housing starts, 1.21 million, edging up to 1.25 million in 2017; and auto sales, 17.4 million, in 2016 and 17.1 million in 2017. The unemployment rate is expected to remain unchanged at 4.8% through 2017.
Ake said the ISM Manufacturing Index fell below 50 last September and did not rise above 50 until March.
“We did not have an actual recession, but we had a manufacturing recession,” he said, “and for people in this industry, that hurts. A manufacturing recession is a strange term because that means manufacturing is in recession and the rest of the economy is growing fast enough that it offsets that. Which is a unique phenomenon. For manufacturing to be below 50 for six months and not have the economy go into a recession is unique.
“I would contend that we should watch this one. If it goes below 50 sometime later this year, I think it signals a problem comparable to a patient in the hospital who has been down and sick, gets better, and then sometimes unfortunately you have that relapse.”
He said the US truck freight outlook was good in 2013 and 2014, but started softening in the second quarter of 2015 and is projected to get even softer this year, but only by 1%.
“That’s what is causing problems on the truck side, not the trailer side,” he said.
Total Class 8 truck loadings grew steadily starting in 2011, but there was a 4% drop (about eight million loadings) to start this year. That is expected to stabilize as the year goes on, but is forecast to steadily drop in 2017 back down to the level experienced at the beginning of this year. Explaining the dropoff to start this year, Ake said, “We’re back to that slide about the manufacturing recession. That’s what drives our industry, and that hurt.”
FTR’s Truck Loadings Index has maintained positive growth since the middle of 2010, but is weakening now because of the manufacturing recession, lower freight, and reduced manufacturing activity.
US truck loadings originated are forecast at 700 million and 740 million in 2017, topping the 2006 peak of 700 million.
“Way back when we had the financial crash, people talked about how it was similar to Japan, with 10 years of no economic advancement, and people said that will never happen to the US economy because it’s not like Japan,” he said. “But looking at the freight forecast, freight peaked in 2006 and we will hit that same level this year. Do the math. That’s 10 years. It may not be an economic loss of 10 years, but it is a freight loss of 10 years.”
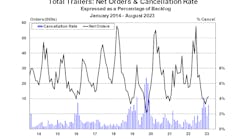
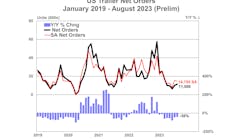
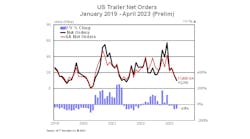
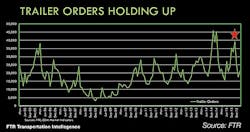
Trailer orders hit the third-highest level ever in November at 39,000.
“The reason why that is so strange is that the trailer market had already peaked and started on its downturn very slightly,” Ake said. “Usually when that happens, you don’t get huge orders. So the fact that in November we hit the third-highest total ever is unique.”
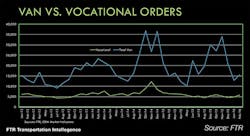
Vocational orders—everything that’s not a van—have been steady around 5000 per month for over three years. But total van orders hit 34,000 in November and then plunged to 13,000 in January.
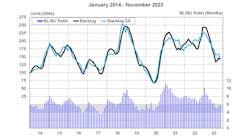
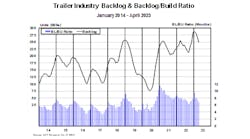
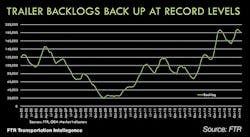
“The van orders jumped huge—almost up to where we were at the end of 2014,” Ake said. “So the jump in orders has been in vans and not vocational. That’s created a thing where we’re back to record backlogs (188,000 in January). That’s very strange once you hit the peak. Typically you hit a peak or come down fast or slow, but you come down. You don’t jump back up. And so this is a very unusual pattern also.”
In terms of US trailer build per day, January and February were at nearly the same level (1150) as they were a year ago.
“The market peaked in the middle of last year, then it came down, and now it’s inching back up,” he said. “It should stay in that level for a few months, but you’re probably not going to get back to that peak production level. The drop-off is not significant.”
Ake said he decided to compare the 1999 backlog cycle to 2015 because the backlog number in 1999 is almost identical to the backlog number in 2015.
“I look at 11 months before the run-up until you get to the peak, and then we’re following what happens to the backlog,” he said. “The November orders were unusual. At the beginning, the backlog is coming down almost identical to ‘99. In fact, the 2015 cycle went below the ‘99 cycle for a few months. Then it jumped back up again. That is very different than what we saw in ‘99. Now it looks like it peaked and is on the way down. If it follows the pattern, we’re still enough above it so we can have a big year.”
Ake did the same thing for the build cycle in 1999 and 2015, and the numbers are very close. He cautioned to watch the April build.
“We have had a very unusual circumstance. The upcycle has peaked—backlogs should be declining faster than they are. Freight growth has slowed, so demand should be cooling. We should not have seen that November spike. The Class 8 market is falling significantly, and trailers should be somewhat in sync. It makes it a very difficult forecast environment.”
There has always been a significant decrease in the first year after a peak trailer build. It was 31% in 1996, 15% in 2000, and 24% in 2007. But this year, the forecast is for just a 7.5% drop.
Because the truck market had dipped and the trailer market hadn’t, Ake decided to chart the trailer versus truck build, using a three-month moving average, which does tend to smooth out the data. They have followed each other pretty closely since 1997, but in January, the Class 8 build dropped significantly from where the trailer build is.
“There is a gap, and that gap is important,” he said.
He did the same thing with trailer and Class 8 orders, and found a close correlation.
“This amazed me because orders are volatile,” he said. “With those orders, the historical correlation is still 80% highly correlated. Even from the middle of 2013 to the middle of last year, that correlation was even higher. It was 87%, which was surprising. But we hit June and while trailers shot up, Class 8 trucks flattened. It’s so significant. You hit June, and it’s unprecedented, and it is a bit difficult to explain.”
In terms of US Class 8 orders versus vocational trailers, they match up very closely.
“But here is the bad news: This is the worst news I will give you today,” he said. “The vocational market, including the platforms, is operating normally. I’ve heard a lot of people complain about what’s happening with the flatbed market. Flatbeds, unfortunately, are behaving normally, matched up perfectly with Class 8. It’s the van trailers where the difference is. So we’ve got to look at that.”
He said dry van loadings and refrigerated van loadings are both very strong—dry vans should grow 1.3% this year and 2.4% next year, with reefers going from 3.2% to 3.8%—but not for the same reason.
“Now it gets even more complicated,” he said. “We’re so used to segments in the trailer industry just following each other the same. Now we’ve got vocational operating much differently than vans. Then you take the van market, and the van market is operating similar but for different reasons. Dry van freight is kind of average but refrigerated freight is very strong.
“I had a smile when Bob Costello said, ‘I‘ve been trying to figure out why refrigerated freight is so strong.’ And so am I. It’s difficult. Whenever you have shifts like this in real time, these are really theories about what’s happening. We’ll understand it afterwards, but in real time, it is difficult to understand. But you know it’s there because you can look at the data.”
His theory about refrigerated vans:
• Strong harvests have increased production of fruit, fresh vegetables, and meat, so we’ve got to move it.
• Some pent-up replacement demand from the recession.
• Regulations accelerating some replacement demand.
• Increased use of drop-and-hook. “All the explanations that Bob gave about driver productivity and pocketbooks, they’re starting to fit the refrigerated market because driver productivity is so important. Shippers and companies are figuring how to do that economically, so pressure on productivity creates market change.”
• Changes in the food distribution network—new locations, logistics, and consumer preferences require more trailers. “We have an increased appetite for prepared foods. Monday, my breakfast was a microwaveable frozen breakfast sandwich. My lunch was a frozen dinner. This convenience thing is shifting demand and it’s causing an increase in reefer freight and how it’s moved. And it’s increasing demand for reefer trailers.”
The Restaurant Performance Index bottomed out at 96.5 in January 2009 during The Great Recession, but had climbed all the way to 103 in January 2015. Since then, it has retreated dramatically and fell below 100 in January.
“That worries me,” he said. “That’s disposable income. That’s consumer spending. We need to watch that, because that is not good.”
His theory about dry vans:
• Excessive pent-up replacement demand.
• Continuous increase in drop-and-hook to increase efficiency.
• Businesses using trailers as “mobile warehouses” instead of building more storage facilities. “Even after The Great Recession, you still have people risk-averse,” he said. “They don’t want to build new facilities. They’re stuffing trailers outside the facility for as long as they think it makes sense.”
He said The Great Recession disrupted the dry van replacement cycle. After Wabash National president Dick Giromini explained it to him 18 months ago, he ran the numbers. He went back 10 years from each of the years since The Great Recession started, and charted the dry van build for each of those years.
“You look at what needed to be replaced in 2008, 2009, and 2010 versus what was built,” he said. “Remember why the build was low: We were in The Great Recession. So the pent-up demand of those three years was 384,000 units. We’re going to assume from 2011 that we need to exceed the number 10 years ago, and we have. Except that we haven’t exceeded it by much. So when you do the math, 215,000 trailers may still be needed in pent-up replacement demand. Now the 215,000, that’s not an exact measurement, but it says that there is a bunch of old trailers that still need to be replaced. And that is the best explanation we have for what’s happening on the dry van side.”
He has previously said that pent-up demand can’t be calculated, but in this instance, he tried.
“In 2016, right around 60,000 dry vans are the pent-up demand,” he said. “Under normal circumstances, that wouldn’t be there, but they are there now. That’s why you have a difference between truck demand (235,000) and trailer demand (306,000). There are other factors in there, but this is the best explanation I can give to you. It’s a calculation off the data, not a theory, not a guess. Wabash has been talking about this for the last two years. So I think it has a lot of validity.”
His forecast assumptions:
• Dry vans stay strong through Q2. “It’s difficult to predict when the pent-up demand softens and slows down based on the economic situation, because people are not just going to continue buying at this pace in this environment. The forecast is for a slower pace.”
• Refrigerated van demand also stays high through Q2 based on strong backlogs and market factors. “Based on what we’ve seen, the refrigerated van market because of those factors is stronger, and I think it will be able to withstand any disruptions in freight. It’s stronger than any of the segments. It’s looking very good.”
• Vocational markets stabilize at lower levels than 2015. “I think they have stabilized—it looks like they’ve stabilized. The thing to be a little worried about is Class 8.
• The second half of 2016 is weaker due to the historical down cycles, slower freight growth, and falling Class 8 demand. “It’s slowing down, but not falling off the table.”
In the Q&A after his presentation, Ake was asked about the effect of the slowdown in the oil fields on tank trailers, especially dry bulk.
“You read the stories that frackers were making so much money that they were buying tankers like crazy,” he said. “They didn’t even care about future demand. They were awash in cash. They were buying and getting stuff out there. When the party ended, it was tremendously bleak on that side because not only did demand stop, but you had all this new equipment out there that people could get cheap, so it devastated the dry side. On the liquid tanker, we found that the industrial sectors, the industrial production slowed down. For a while, the petroleum side dipped and now is stabilizing. I think it’s stable now, but it’s tied into the economy of the industrial production.” ♦
